One of the main highlights of this app is the player list screen. It uses LazyVGrid to efficiently render a grid of player images and names, adapting to different screen sizes. Each player's card is a reusable SwiftUI view that cleanly separates layout from logic. To keep performance smooth, player data is pulled from a local JSON file, and images are bundled within the app. This structure makes it easy to update the roster and scale the design in the future.

Tapping on a player card navigates to a detail view built using NavigationStack. This view presents additional player information such as position, height, weight, and jersey number. The layout is minimal yet informative, making use of SwiftUI’s declarative syntax to stack and space UI elements cleanly. Animations and transitions between views are kept subtle, ensuring the focus remains on the content while still showcasing SwiftUI’s ability to handle navigation elegantly.

From a development standpoint, the app is structured with modularity and clarity in mind. Views are broken into reusable components, and data models conform to Codable for clean parsing of the roster JSON. The project demonstrates practical SwiftUI usage including data-binding, conditional rendering, and modern layout patterns. Screenshots of the UI code highlight how SwiftUI’s syntax allows for readable and concise layout logic.

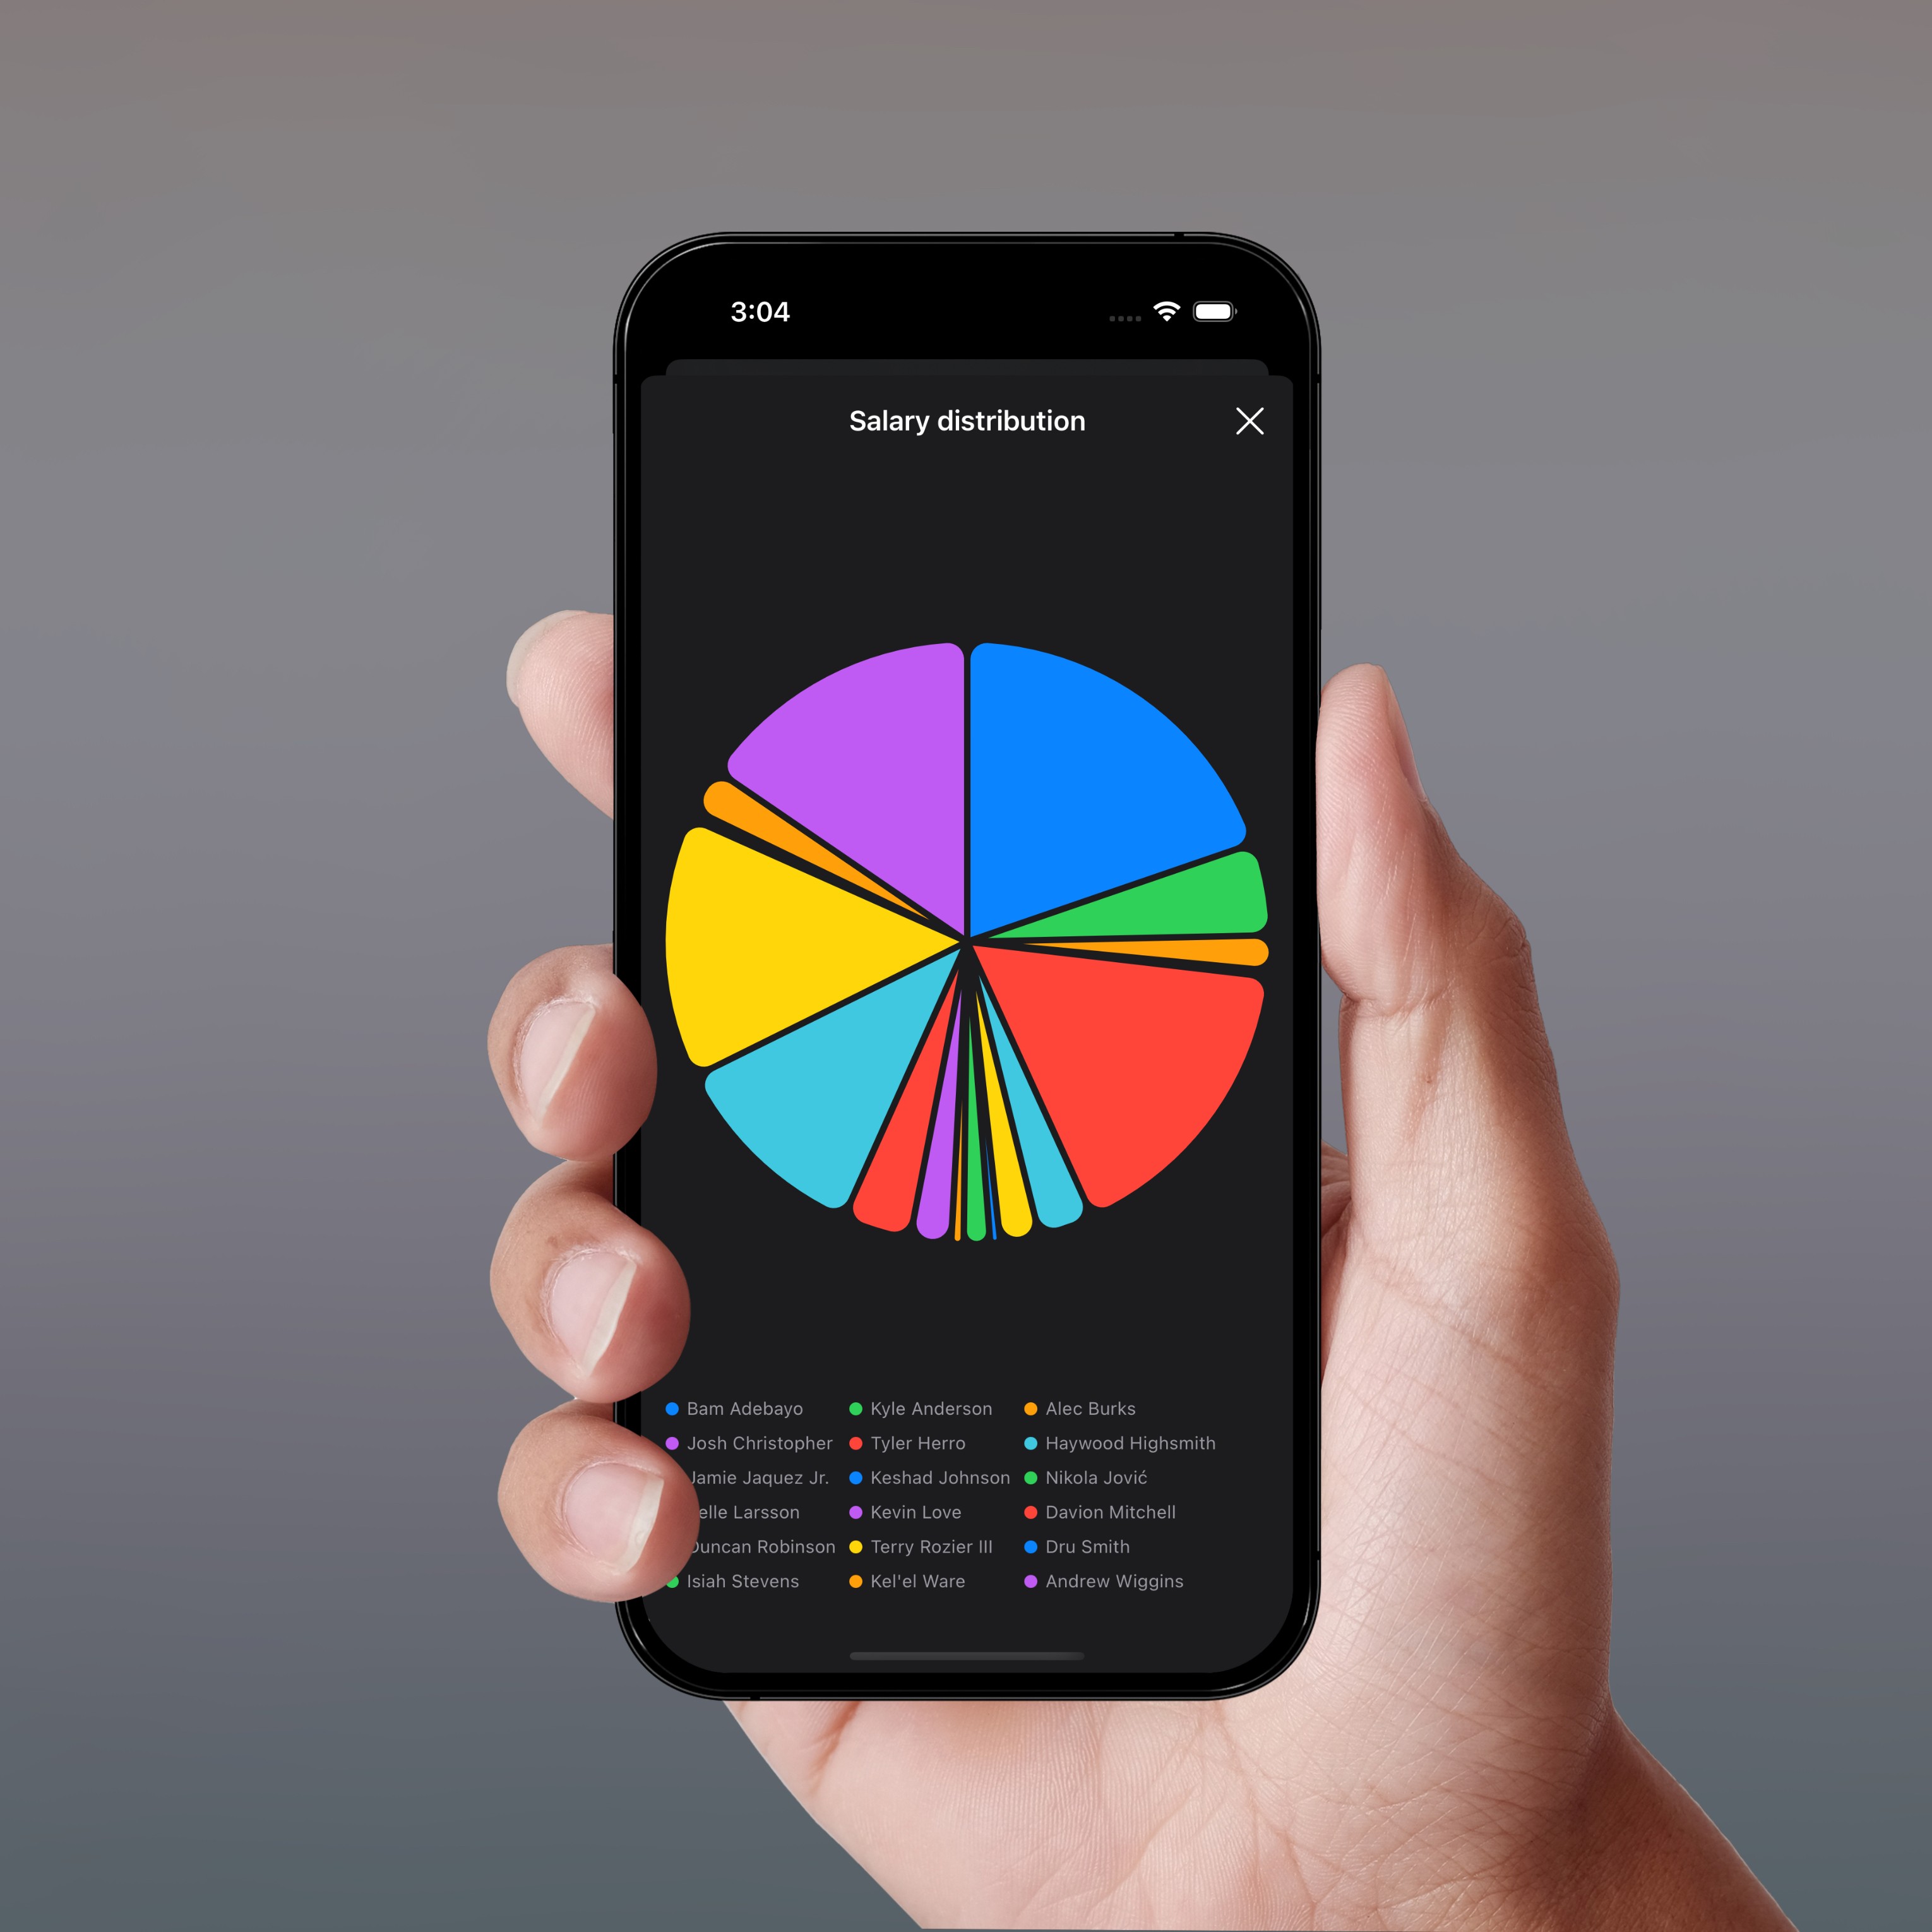
To visually represent the distribution of player salaries, I implemented a pie chart using SwiftUI’s Charts framework. Each segment of the chart corresponds to a player, with the size of the slice proportional to their 2024-2025 salary. Since salary values were originally stored as strings with commas, I cleaned and converted them to Double values before using them in SectorMark components. To enhance readability and user interaction, each segment is color-coded and labeled using the player's name. The chart is displayed in a sheet view, accessible via a button on the main screen.